CHLORINITY AND SALINITY OF SEAWATER
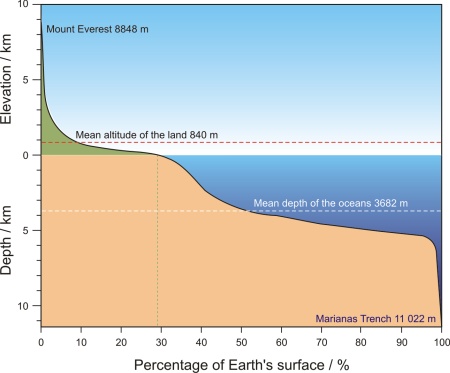
Most of the Earth is covered in water. The Earth's surface is 510 100 000 km2, of which land covers 148 800 000 km2 (29.2 %) and the world's oceans 361 300 000 km2 (70.8 %). The average sea depth is 3711 m, while the average altitude is only 840 m above sea level. As such, the seas are on average deeper than the land is tall. The relief of the sea bottom is also much more irregular than the one on land, with numerous large mountains and deep trenches. If the highest mountain on Earth (Mount Everest, 8848 m above sea level) was placed at the bottom of the Pacific Ocean (Mariana Trench, 11 022 m deep) its peak would be more than two kilometers below the surface. Due to the vastness of the sea, the inhospitably of its environments, and the variations from place to place, it is said that the surface of the Moon is more familiar than the topography of the sea.

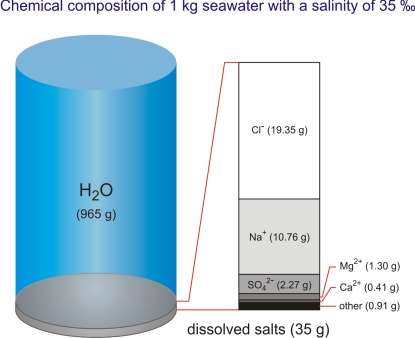
By its chemical composition the sea is an unsaturated homogeneous solution consisting of water as a solvent (96.5 %), dissolved salt (3.5 %), minor amounts of particulate matter, dissolved gasses, and organic components. There is also a continuous exchange between the sea and atmosphere, and the sea and sea bottom. Gasses, liquids, and particles in dissolved and undissolved forms continuously circulate through the sea.
Each liter of the ocean (and there is about 1.34·1012 L in the ocean) contains approximately 34 g of dissolved salts (at 10 °C and salinity of 35 ‰ the density of seawater is 1.0270 kg/L). To date, more than 90 chemical elements have been identified in the sea. They can be classified into two groups: main elements or macroconstituents, and trace elements or microconstituents. Macroconstituents form 99.95 % of dissolved mater, of which sodium and chlorine account for more than 85 % of the total amount.

By examining the concentration of the most common salts in seawater it was established that their relative ratio was constant irrespective of their absolute quantity. If we know their ratio we can calculate the amount of a particular salt, or the total amount of salt by determining only one constituent. The ratios of the most common species in the Standard mean ocean water are given in Table 1.
| Species | Z | M / gmol-1 | X / 10-3 | X·Z / 10-3 | W |
|---|---|---|---|---|---|
| Cl- | -1 | 35.453(2) | 487.4839 | -487.4839 | 0.5503396 |
| Na+ | +1 | 22.989 769 28(2) | 418.8071 | 418.8071 | 0.3065958 |
| SO42- | -2 | 96.062 6(50) | 25.2152 | -50.4304 | 0.0771319 |
| Mg2+ | +2 | 24.305 0(6) | 47.1678 | 94.3356 | 0.0365055 |
| Ca2+ | +2 | 40.078(4) | 9.1823 | 18.3646 | 0.0117186 |
| K+ | +1 | 39.098 3(1) | 9.1159 | 9.1159 | 0.0113495 |
| HCO3- | -1 | 61.016 84(96) | 1.5340 | -1.5340 | 0.0029805 |
| Br- | -1 | 79.904(1) | 0.7520 | -0.7520 | 0.0019134 |
| B(OH)3 | 0 | 61.833 0(70) | 0.2807 | 0 | 0.0005527 |
| CO32- | -2 | 60.008 9(10) | 0.2134 | -0.4268 | 0.0004078 |
| Sr2+ | +2 | 87.62(1) | 0.0810 | 0.1620 | 0.0002260 |
| B(OH)4- | -1 | 78.840 4(70) | 0.0900 | -0.0900 | 0.0002259 |
| F- | -1 | 18.998 403 2(5) | 0.0610 | -0.0610 | 0.0000369 |
| CO2 | 0 | 44.009 5(9) | 0.0086 | 0 | 0.0000121 |
| OH- | -1 | 17.007 33(7) | 0.0071 | -0.0071 | 0.0000038 |
| TOTAL | 1 000 | 0 | 1.0 |
The amount and ratio of trace elements in the sea are variable. These are things the organism needs in small amounts (micronutrients), but they are of great importance for health and the maintenance of life functions. Their presence or absence often determines whether some type of organism is going to develop and survive.
Salinity
The most characteristic feature of seawater is its salty taste. The total amount of salt (expressed in grams) dissolved in one kilogram of seawater is referred to as salinity (‰). Salinity is of great importance for the physical and biological properties of seawater, or rather those living in it, and it is the result of long-lasting interactions between the processes that have taken place (and still persist) between the atmosphere, hydrosphere, and biosphere. The Adriatic Sea has a relatively high average salinity of 38.3 ‰, unlike the average salinity of the ocean which is 35 ‰.
There is most likely no physical property unaffected by salinity. A change in salinity affects density, osmosis, heat capacity, viscosity, thermal and electrical conductivity, refraction, the speed of sound propagation, surface tension, etc. By increasing salinity the freezing point decreases while the boiling point of the sea increases.

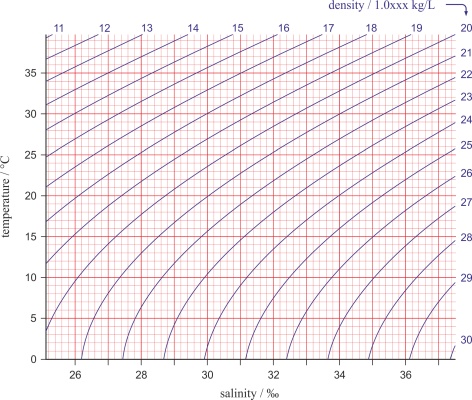
In practice its common to display temperature and salinity with a TS diagram (temperature-salinity diagram) in which the sigma-t lines (σt) represent density (in kg/m3) reduced by 1000. Density is one of the most important parameters that determine the dynamic properties of seas and oceans, and it is the main drive behind the constant flow of seas and oceans (in both horizontal and vertical directions).
There are many ways to determine the salinity of the sea, but the most commonly used are:
- Gravimetric determination (from dry residue)
- Volumetric determination (from chlorinity)
- Conductometric determination (from electrical conductivity)
Determination of salinity by evaporation
Salinity can be determined by direct evaporation by evaporating a sample of seawater and then heating the dry residue at 480 °C until it becomes a constant mass. In addition to the loss of volatile matter during the heating process, the measurement is made difficult by the great hygroscopicity of the obtained precipitate.
The Danish physicist Martin Knudsen (1871-1949), defined salinity as the total amount of dissolved soils in grams contained in one kilogram of seawater when all of the carbonates are turned into oxides, bromine and iodine are replaced with chlorine, and all organic matter oxidizes.
Determination of chlorinity
Unfortunately, direct determination of salinity was not practical, so based on the idea of the ratio of dissolved seawater components being constant there was a new plan to measure only one parameter - chlorinity, or rather the chlorine, bromine, and iodine content in seawater, and then calculate salinity from that. By measuring salinity and chlorinity in samples of seawater from different parts of the world Knudsen devised an empirical formula for determining salinity in 1889:
This formula was in use until 1962 when the Joint Panel for Oceanographic Tables and Standards (JPOTS) established a new proportionality constant in Knudsen's formula:
The equation above does not apply to highly diluted probes where salinity is extremely low (for example the Baltic Sea or the mouth of a river).
Conductivity measurement
Meanwhile, the development of electrical conductivity measurement devices led to fast, cheap, and precise methods of determining the salinity of seawater. Since the conductivity of seawater depends on the amount of dissolved matter, JPOTS defined in 1978 the Practical Salinity Scale (PSS-78) which is still the most common way of determining the salinity of seawater.
The change in determination technique also led to a change of standards, and so the currently internationally accepted standard is the Determination of the Practical Saltwater IAPSO Standard Seawater produced by the Ocean Scientific International Limited (OSIL).
Practical salinity SP is defined on the 1978 Practical Salinity Scale (PSS-78) in terms of the conductivity ratio K15 which is the electrical conductivity of the sample at temperature 15 °C and pressure equal to one standard atmosphere, divided by the conductivity of a standard potassium chloride (KCl) solution at the same temperature and pressure. The mass fraction of KCl in the standard solution is 0.032 4356 (32.4356 g of KCl in 1 kg of solution). When K15 = 1, the Practical Salinity P S is by definition 35. (under the above mentioned conditions the conductivity of both solutions is 429.14 S/m). Practical salinity is defined by the following equation which is valid for salinity of 2 to 42:
For temperature and pressure measurements that differ from standard the conductivity ratio R can be represented as a product of three factors marked with Rp, Rt, and rt:
As you can see from the equation above, the Rt for each sample can be expressed with R (which is measured), as well as Rp and rt (which can be calculated). For each temperature different than t68 = 15 °C Practical salinity is given as a function of Rt (with k = 0.0162). At temperature t68 = 15 °C Rt becomes K15.
The t68 mark tells us that all of the temperatures are on the ITPS-68 scale. In order to use thermometers that are calibrated according to the International temperature scale from 1990 (ITS-90) it is necessary to first convert the temperature to t68 using the factor t68 = 1.00024·t90.
Practical salinity does not have a unit, although it is occasionally (wrongly) attributed PSU (Practical Salinity Unit) to make it look better. But you also have to be aware that even the 'ordinary' salinity does not have a unit - promil means "times one through a thousand" (‰ = *0.001), or 35 ‰ is the same as 0.035. This is evident from the definition itself as it states that salinity is the total amount of salt, expressed in grams (1 g = 0.001 kg), dissolved in one kilogram of seawater.
Determination of chlorinity by the Knudsen method
How salinity was determined in laboratories equipped with a special Knudsen pipette, Knudsen burette, Tables, and Normal water.
Chlorinity is defined as the total amount of halids (chlorides, bromides and iodides) in 1 kg of seawater where iodine and bromide have been replaced with an equivalent amount of chloride. This definition introduces one more equivalent that depends on the change of atomic masses. As such, chlorinity is today defined as the mass of pure silver needed to precipitate all chlorides, bromides, and iodides multiplied by 0.37285233. This way chlorinity has been made independent of changes in atomic masses.
Volumetric determination of halides with the Mohrov method has for many years been the most common method for routine determination of the amount of salt present in seawater samples. The Mohrov method is one of the oldest methods of titration - it was introduced in 1856 by German chemist Karl Friedrich Mohr (1806-1879). Titration is performed using a standard silver nitrate solution (AgNO3) with potassium chromate (K2CrO4) as an indicator.
AgBr and AgI are precipitated together with AgCl.
The problem with Mhor's titration is that silver nitrate is not the primary standard. In order to avoid this problem standard Normal water (with a capital N) was defined with a consistent composition and precisely specified chlorinity (around 19.38 ‰). This water was then used to standardize silver nitrate solutions. This way all measurements of cholorinity referred to the same standard, which allowed all results to be comparable.
Normal water (Eau de mer Normale or Copenhagen Normal Water) is purchased from the Hydrographic Laboratory in Copenhagen (Denmark).
Knudsen pipette
A Knudsen pipette with an automatic zero (Figure 4) allows for quick and accurate pipetting of a constant volume of liquid, usually around 15 mL. At its top is a two-way valve C which can provide flow between the pipette's body and one of the branches (A or B), or isolate the pipette's body from both branches. Suction through branch B fills the pipette with liquid, and turning the valve closes the intake. Opening the valve towards branch A releases the liquid as it allows atmospheric air to enter to enter the pipette. Emptying the pipette takes about 30 seconds. Before first use a new pipette needs to be calibrated with distilled water.


Knudsen's burette
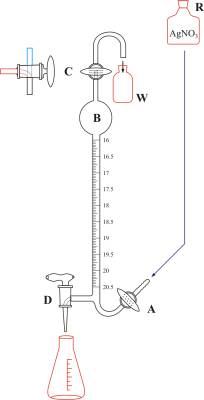
Knudsen's burette with an automatic zero (Figure 5) was designed in order to achieve high measuring accuracy in routine field analysis at the marine lab. The burette is filled with a solution of silver nitrate from the reservoir R located above the burette by opening valve A. When the solution passes the three-way valve C the flow of solution is interrupted by closing valve A. Any possible excess is gathered in the vessel W. The three-way valve C is turned, which also marks the zero on the scale, in order to allow atmospheric air to enter into the burette. Since most oceanic specimens lie in a relatively narrow range of chlorinity the burette is designed so that most of its capacity lies in the expansion at the top of (B). This allows the titration to be quick (by rapidly releasing the contents of the B expansion), and it reduces the error resulting from the solution draining down the burette's walls. Each millimeter is divided into twenty parts (the so-called Knudsen burette division into double millimeters which allows for high precision measurement (the scale is easy to read up to a precision of 0.005 mL). From 0 to 16 the burette has no divisions; they usually start from 16 and go up to 20.5 or 21.5. One double millimeter on the Knudsen burette scale corresponds to one promile of chloride in the sample. This burette can be used for titration of seawater from all oceans and seas, with the exception of those with very low salinity (e.g. the Baltic Sea) and river mouths, which require the use of standard burettes.
Measurement procedure
Before begining a series of titrations of samples of seawater it is necessary to determine the titre (titre is the mass of a titrated substances that is equivalent to 1mL of the solution) of the prepared AgNO3 solution (the solution is prepared by dissolving 37.11 g AgNO3 in 1 L of distilled water). The titre is determined with Normal water whose chlorinity is exactly known (with precision up to the third decimal) and is about 19.38 per mille of chloride. The difference obtained by titrating Normal water is displayed as the α value. It may be positive or negative depending on whether the consumption of slver nitrate per 1 mg of chloride is greater or smaller than 1 double millimeter when titrated with Normal water. The obtained value for chlorinity, based on the value of α, is then corrected with Knudsen's hydrographic tables. After we have corrected the obtained values of chlorinity and received the true values we can extract the values for salinity and density from the hydrographic tables.
Normal water is used as a basis for determining the amount of consumed AgNO3 that corresponds to 19.381 ‰ of chloride. As such, one double ml of consumed AgNO3 on Knudsen's burette corresponds to exactly 1 ‰ chloride. This way we get the AgNO3 solution whose titre needs to approximately correspond to one promile of chloride. K2CrO4 serves as an indicator in order to determine the point where all chloride has precipitated in the form of an insoluble silver chloride, because at exactly that moment Ag2CrO4 begins to precipitate, which can be easily seen as the solution changes color from yellow to light brown. This change in color is based on the difference in solubility between AgCl and Ag2CrO4.
Results
We can briefly demonstrate the method for determining salinity:
| The chlorinity of Normal water (read from a standard label) | N = 19.381 ‰ | |
| Results from the burette used for titration of Normal water | A = 19.515 | |
| Difference (N - A) | α = -0.134 | |
| Results from the burette used for titration of a sample of seawater | a = 19.62 | |
| Correction for α from the Hydrographic tables | k = -0.14 | |
| Chlorinity of the seawater sample | Cl = 19.48 ‰ | |
| Based on the obtained values for chlorinity we can find data for S and σt in the Tables | S = 35.19 ‰ σt = 28.28 |
| Date | Temperature | Number of measurement | Burette reading | Cl / ‰ | S / ‰ | Note |
|---|---|---|---|---|---|---|
| 14/11 | 23 °C | 20 | 19.03 | 19.08 | 34.47 | α = +0.040 |
| 21 | 19.07 | 19.12 | 34.54 | |||
| 22 | 19.14 | 19.18 | 34.65 | |||
| 23 | 19.165 | 19.205 | 34.70 | |||
| 23 °C | Normalna voda | 19.345 | 19.12 | 34.54 | P16:19.380 | |
| 24 | 19.135 | 19.175 | 34.64 | α = +0.035 | ||
| 25 | 19.125 | 19.165 | 34.62 | |||
| 26 | 19.16 | 19.20 | 34.69 | |||
Bibliographie:
- "United Nations Atlas of the Oceans." UN-Oceans. 3 Aug. 2011. <http://www.oceansatlas.com>
- "OSIL Seawater Standards." Ocean Scientific International ltd.. 3 Aug. 2011. <http://www.osil.co.uk/Products/SeawaterStandards/tabid/113/agentType/ViewType/PropertyTypeID/25/Default.aspx>
- IOC, SCOR and IAPSO, The international thermodynamic equation of seawater - 2010: Calculation and use of thermodynamic properties. Intergovernmental Oceanographic Commission, Manuals and Guides No. 56, UNESCO, 2010.
- J.P. Rilej, G. Skirrow, Chemical Oceanography, Vol. 1-7, Academic Press, London, 1975.
- E. Merian, M. Anke, M. Inhat, M. Stoeppler, Elements and their Compounds in the Environment, Wiley VHC, New York, 2004.
- Helge Thomsen, Instructions pratiques sur la détermination de la salinité de l'eau de mer par la méthode de titrage de Mohr-Knudsen, Bulletin de l'Institut Océanographique, No. 1047, 1954
Zitieren dieser Seite:
Generalic, Eni. "Chlorinity and salinity of seawater." EniG. Periodensystem der Elemente. KTF-Split, 13 Feb. 2025. Web. 29 Mar. 2025. <https://www.periodni.com/de/chlorinity_and_salinity_of_seawater.html>.
Tabellen und Artikel
- Periodensystem
- Online-Taschenrechner
- Wissenschaftlicher Rechner für Chemiker
- Gasgesetzen Rechner
- Molmassenrechner
- Winkelkonverter
- Römische Zahlen umwandeln
- Numerische Systeme konvertieren
- Herstellung von Lösungen
- Kennzeichnung von Chemikalienbehältern
- Oxidationszahlen Rechner
- ARS methode
- Oxidationszahlmethode
- Ionen-Elektronen-Methode
- Eliminationsmethode von Gauss
- Memory-Spiel
- Paare finden
- Tabellen und Artikel
- Chemie
- Liste mit Akronyme und Abkürzungen
- Kristallsysteme und Bravais-Gitter
- GHS - Gefahrenpiktogramme
- NFPA 704 Gefahrendiamant
- Fundamentale Physikalische Konstanten
- Löslichkeitsprodukt-Konstante
- SI - Internationale Einheitensystem
- Zusammensetzung von Mischungen und Lösungen
- Stöchiometrische Rechnung
- Chlorinity and salinity of seawater
- Rare earth elements (REE)
- Ökologie
- Webdesign
- Chemiewörterbuch (Englisch-Kroatisch)
- Chemie
- Downloads
- ≡ Menü
