GLOBAL WARMING AND MANKIND
- Climate change
- Global warming and mankind
- Story of ozone and ozone holes
- World War 3: Battle for Earth
The first thing that we should notice is that those that talk about global warming can't go on for two sentences without mentioning greenhouse gasses or their effect. In order for us not to remain confused by their "big words", let us answer some questions.
What is the greenhouse effect?
Directly or indirectly, all of the energy that we use comes from the Sun, even the fossil fuels we use today simply represent Sun's energy stored long ago in plants (coal) and animals (oil).
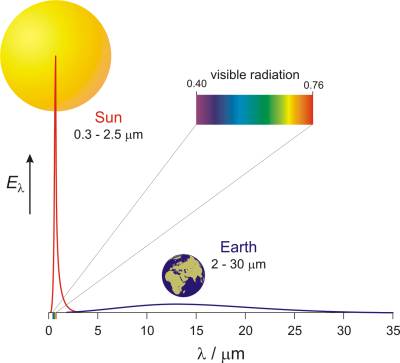
Where does the Sun get all this energy? The Sun is a giant heated ball (with a mass of 333 000 times greater than that of Earth) in which hydrogen (more then 600 million tons per second) is transformed in to helium through nuclear reactions of fusion releasing massive amounts of energy (4×1026 J per second). If we go by Planck's law of radiation for bodies heated to 6000 K, the Sun will spread its energy so that 9 % of it is in the ultraviolet (120-400 nm), 41.5 % in the visible (400-760 nm), and 49.5 % in the infrared (above 760 nm) area of the electromagnetic spectrum, with a maximum in the visible area at the wave length of 480 nm (Fig. 4). [15]
Fig. 4. Spectral density of the energy current of incoming solar radiation and the thermal radiation from Earth (Krpan-Lisica, 2001). → Download high quality image
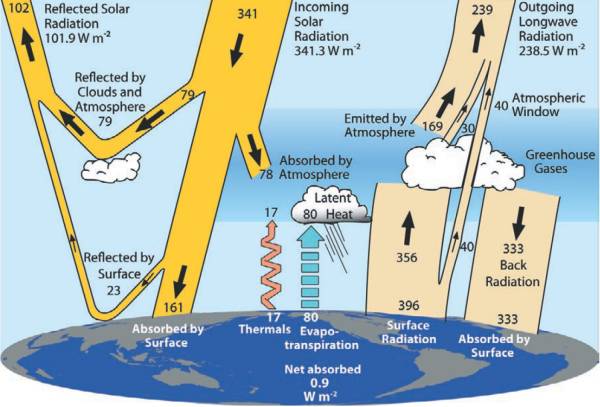
8 minutes and 19 seconds later, a small part of the Sun's radiation (only 0.000000045 %) will reach Earth - where we arrogantly call it solar radiation (TSI, Total Solar Irradiance). From that Solar radiation Earth absorbs around 70 % (25 % in the atmosphere and 47 % on the surface) and 30 % is reflected back in to space (from the atmosphere, clouds, sea and land). You can see how this looks in Fig. 5. [16, 17]
Fig. 5. The global annual mean Earth's energy budget (Trenberth, 2009.).
When Earth is this heated it radiates itself. However, since Earth is relatively cold (around 15 °C), and since the Sun obeys Planck's law, her radiation falls in the area of larger wave lengths, from 2 μm to 30 μm (infrared area). In Fig. 4 you can see the spectral density of the energy current, Eλ, incoming solar radiation and Earth's heat radiation in correlation with the wave length, λ.
CO2 molecules, when faced with incoming solar radiation act as a transparent body. However when faced with outgoing radiation from Earth they act almost as a black body. In other words, CO2 molecules are very good at letting through the visible spectrum of radiation originating from the Sun while almost completely blocking outgoing infrared radiation emitted from Earth, so it isn't able to pass through the atmosphere. The absorbed infrared radiation CO2 molecules emit partially towards higher layers in the atmosphere and partially back towards Earth. This returning infrared radiation helps keep relatively high temperatures on the surface of Earth. This is essentially the same process being employed in green houses hence the effect is named the greenhouse effect. The term "greenhouse effect" was coined in the 18th century by the French mathematician and physicist Jean-Baptiste Joseph Fourier (1768-1830). Thanks to the greenhouse effect the average yearly temperature of the Earth's surface was comfortable 15 °C (288 K) and without it the temperature would be drastically lower, -18 °C (255 K), whole 33 degrees lower.
Why the commotion around the greenhouse effect then?
Because, if the worst predictions come true, the global warming in the next century will lead to a rise of the ocean level and the melting of glaciers, the frequency of extreme weather events (bigger and stronger storms, waves, heats, floods ...) will also increase and due to the warmer environment there will be a massive outbreak of insects which will significantly endanger public health.
Some climatologists believe that if the global warming continues there will be a sudden meltdown of the Greenland ice cower which will lead to a temperature and salinity decline so large that the currents of the Atlantic ocean will stop, which will result in a flash freeze, or in other words a mini ice age.
And the only one to blame for all of this will be man and his uncontrollable release of the greenhouse gasses.
What are greenhouse gasses?
The definition of greenhouse gasses is: greenhouse gasses are gasses that allow unhindered passage of short wave sunlight (visible part of the spectrum and ultraviolet radiation), and absorb long wave radiation (infrared radiation).
Carbon dioxide isn't the only one, nor is the most common or the most effective greenhouse gas. The others are water vapor (H2O), ozone (O3), methane (CH4), nitrogen(I) oxide and some purely synthetic gasses which aren't present in the nature: chlorofluorocarbons (CFCs), hydrofluorocarbons (HFCs), perfluorocarbons (PFCs), sulfur hexafluoride (SF6) - just to list the most important. However, their absorption spectrums sometimes overlap and when it comes to the greenhouse effect, two plus two doesn't always equal four. In order to remove all the CO2 from the atmosphere only 15 % less infrared radiation would be absorbed, and if CO2 was the only greenhouse gass he'd absorb only 26 % of the infrared radiation that is currently being absorbed in the atmosphere.
In order to simplify the measuring of the effect of emissions and emission trading (sic!) it was internationally agreed to express the effect of every greenhouse gas as the equivalent of carbon dioxide (CO2e, equivalent carbon dioxide) which is obtained by multiplying the mass of the respective greenhouse gas with the associated potential of global warming (GWP, global warming potential). GWP itself is defined as a ratio between the absorption efficiency of solar IR radiation for 1 kg of a greenhouse gas in a specific time period and the absorption efficiency of solar IR radiation for 1 kg of a referent gas (usually CO2) in the same time period. GWP is calculated for a specific time period (usually 20, 100 and 500 years), which must be stated when showing GWP values. [18]
In Table 1 you can see estimated GWP values of some greenhouse gasses published in the fourth report on climate change published in 2007 by IPCC.
| Gas | Lifetime (years) | GWP (20 years) | GWP (100 years) |
|---|---|---|---|
| CO2 | 5-200 | 1 | 1 |
| CH4 | 12 | 72 | 25 |
| N2O | 114 | 289 | 298 |
| CCl3F | 45 | 6730 | 4750 |
| CHF3 | 270 | 12000 | 14800 |
| SF6 | 3200 | 16300 | 22800 |
Which gas is the most responsible for the greenhouse effect?
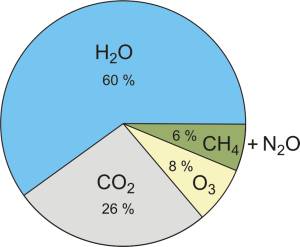
You have to keep in mind that the effect of a specific greenhouse gas depends on it's life span in the atmosphere, that is the time needed for the observed gas to be removed from the atmosphere and pass in to another form (for example: CO2 turns in to biomass and O2 through photosynthesis) and of course, the amount of the specific gas in the atmosphere. The contribution of the most important greenhouse gasses to the greenhouse effect (on a cloudless sky) can be seen in Fig. 6. [19]
Fig. 6. Contribution of the most important greenhouses gasses to the greenhouse effect (Kiehl, 1997.). → Download high quality image
Water vapor
The most abundant and important greenhouse gas in the atmosphere is water vapor. If you removed the clouds and all other greenhouse gasses water vapor itself would absorb 60 % of the Earth's radiation. Amounts of water vapor in the atmosphere vary heavily - they go from over 100 % in extremely damp areas (tropical rain forests) to near 0 % in extremely dry areas (deserts - the two largest ones are the hot Sahara and the cold Antarctic). The life span of a water molecule in the atmosphere is only a week. The influence of water on global warming and the effect of global warming on the amount of water in the atmosphere could be discussed for ages. For now all you need to know is two facts: first, warm air can take a lot more water vapor than cold air, and second, clouds cool the Earth (more solar radiation is reflected from the clouds in to space than Earth's radiation back on to the surface). Human activity (aside from global warming) does not add significant quantities of water vapor to the atmosphere so it is not considered an anthropogenic greenhouse gas. [20]
Carbon dioxide
Carbon dioxide (CO2) is a natural part of the atmosphere and is in concentrations present in the atmosphere. It does not endanger our health and without it life on Earth would not be possible. It is common practice in greenhouses to enrich the atmosphere with CO2 which results in larger quantity and quality of produced vegetables. Increasing the concentration of CO2 above 1000 ppm nets a 40 % increase in productivity. Also, keep in mind that greenhouses are usually heated in order to have the optimal temperature for the plants to grow in. Why is then the increase of CO2 in the atmosphere harmful? [21, 22]
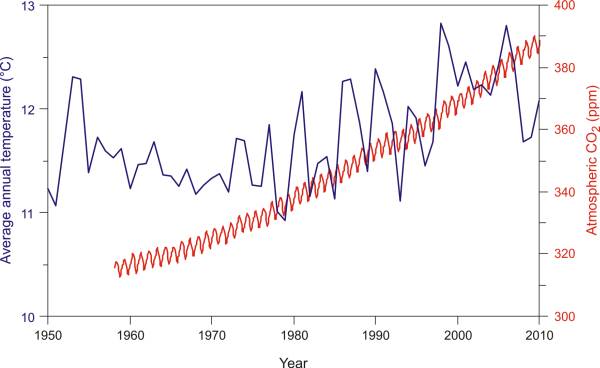
Continuous measurements of the CO2 concentration in the air have been done since 1958 every year in the Mauna Loa observatory in Hawaii, far from the sources of industrial pollution. You have probably already seen their data but you can look through them once more at Fig. 7, this time placed over the average rise of annual temperatures in the USA. A constant increase in the CO2 concentration is noticeable along with seasonal variations which develop due to biological processes that use and release CO2. Why is the CO2 concentration in the atmosphere constantly rising? [23, 24]
Fig. 7. Concentration of CO2 in the atmosphere (observatory Mauna Loa - Hawaii) compared with the average rise of annual temperatures in the USA (NOAA, 2011). → Download high quality image
The main culprit for the constant increase in the quantity of CO2 in the atmosphere is the combustion of fossil fuels (in energetics, transport, manufacturing of cement etc.). Specific emission of individual product's combustion greatly depends on the type of fuel (look at Table 2 to see how it is in the energy prodiction). Just so you know, the stove you used this morning to cook your coffee uses up 2 kW/h. Notice that the emission of nitrogen oxides does not depend on the type of fuel - which is logical because its source is not the combustion of fuel but rather the combustion of air. Lowering their emissions can be done by constructing better fireplaces. The term NOx is used for a compound of NO and NO2 which develops at high temperatures in fireplaces during the combustion of fuel (the product is mostly NO but commonly, due to very rapid cooling of smoke gasses and with enough oxygen, significant amounts of NO2 develop.
| Fuel type / Products of combustion | H2O | CO2 | CO | SO2 | NOx | CmHn | Ash and soot |
|---|---|---|---|---|---|---|---|
| Coal | 145 | 1070 | 0.054 | 7.9 | 2.35 | 0.032 | 0.86 |
| Heavy fuel oil | 200 | 720 | 0.001 | 7.2 | 2.4 | 0.096 | 0.29 |
| Light fuel oil | 230 | 710 | 0.001 | 2.02 | 2.4 | 0.038 | 0.067 |
| Natural gas | 390 | 550 | 0.001 | 0 | 1.85 | 0.037 | 0.055 |
The amount of CO2 created during transport is not insignificant either. According to the estimate of the international organization for the manufacturing of motorized vehicles (OICA, Organisation Internationale des Constructeurs d'Automobiles) in 2010 there were 77 609 901 newly produced vehicles. The exact number of cars on the roads is unknown - according to some estimates it ranges around 800 million. Try to calculate yourself how transport effects the rise of CO2 levels if you know that combusting one liter of gasoline uses up 1 200 L of oxygen (5 700 L of air) which creates 2.38 kg of CO2. An interesting thing is that only 5 % of the energy gained from fuel is used for the transport of the passenger from one place to another while the other 95 % is used to transport the vehicle itself. [25]
In Table 3 you can see 20 countries which emit 80 % of the world's CO2 emission. Miserable 158 thousand tons of CO2 more would have been enough for Poland to enter that exclusive club. [26]
| 1997 | 2007 | ||||
|---|---|---|---|---|---|
| Country | Total CO2 emissions (Tg CO2) | Fraction of total production | Total CO2 emissions (Tg CO2) | Fraction of total production | |
| 1. | China | 3469.510 | 14.82 | 6538.367 | 22.30 |
| 2. | United States | 5472.972 | 23.37 | 5838.381 | 19.91 |
| 3. | India | 1043.940 | 4.46 | 1612.362 | 5.50 |
| 4. | Russian Federation | 1482.557 | 6.33 | 1537.357 | 5.24 |
| 5. | Japan | 1268.943 | 5.42 | 1254.543 | 4.28 |
| 6. | Germany | 898.672 | 3.84 | 787.936 | 2.69 |
| 7. | Canada | 483.234 | 2.06 | 557.340 | 1.90 |
| 8. | United Kingdom | 554.216 | 2.37 | 539.617 | 1.84 |
| 9. | Republic of Korea | 428.269 | 1.83 | 503.321 | 1.72 |
| 10. | Iran | 290.617 | 1.24 | 495.987 | 1.69 |
| 11. | Mexico | 376.748 | 1.61 | 471.459 | 1.61 |
| 12. | Italy | 432.134 | 1.85 | 456.428 | 1.56 |
| 13. | South Africa | 371.328 | 1.59 | 433.527 | 1.48 |
| 14. | Saudi Arabia | 216.826 | 0.93 | 402.450 | 1.37 |
| 15. | Indonesia | 278.659 | 1.19 | 397.143 | 1.35 |
| 16. | Australia | 334.060 | 1.43 | 374.045 | 1.28 |
| 17. | France | 379.487 | 1.62 | 371.757 | 1.27 |
| 18. | Brazil | 321.200 | 1.37 | 368.317 | 1.26 |
| 19. | Spain | 264.460 | 1.13 | 359.260 | 1.22 |
| 20. | Ukraine | 328.329 | 1.40 | 317.537 | 1.08 |
| TOTAL | 18 696.161 | 79.85 | 23 619.141 | 80.56 | |
| 76. | Croatia | 19.780 | 0.07 | 24.840 | 0.08 |
| Africa (54 countries) | 809.724 | 3.46 | 1133.086 | 3.86 | |
| World | 23 413.534 | 100.00 | 29 319.295 | 100.00 | |
Methane and nitrogen oxides
Anthropogenic sources of methane and nitrogen oxides are usually linked to agriculture. According to a report published by the Food and agriculture organization (FAO) in November 2006 cattle farming are responsible for around 18 % of the total emission of greenhouse gasses (which is more than transport). [27]
Most people know N2O as the laughing gas, but in later years climatologists refer to it as the crying gas. The reason for this is that with the reduction of CFC it became the major cause for the destruction of the ozone layer. N2O is developed in the ground through the process of nitrification (bacteria transform NH3 in to NO3) and denitrification (other bacteria transform NO3 u N2). Emissions from processes related to human activity (around 70 % of which is agriculture) are constantly rising the levels of N2O in the atmosphere by around 1 % every four years. The estimate that natural sources of N2O are responsible for 64 % of the emissions is disputable because of the inability to prove if the nitrate in the waters is of natural or anthropogenic origin. [28]
By shrinking swamp surfaces (drying) natural methane sources (CH4) have been lowered to only 37 % of the total amount of CH4 being emitted in to the atmosphere each year. The main manufacturer of methane are the digestive systems of billions of animals which fart (release winds) and poo (release dung), grown to become food for the ever growing population of Earth.
Researchers have found out that by producing 1 kg of beef meat the amount of greenhouse gasses released is equivalent to 21.73 kg of CO2 (Table 4). [29]
| Source | Emissions (kg CO2e) | Emissions (%) |
|---|---|---|
| Enteric CH4 | 3 443 082 | 63 |
| Manure CH4 | 273 592 | 5 |
| Manure N2O | 1 244 506 | 23 |
| Soil N2O | 206 828 | 4 |
| Energy CO2 | 277 705 | 5 |
| Total emissions | 5 445 713 | 100 |
| (Total live weight = 417 710 kg; total carcass weight = 250 626 kg). | ||
When you eat a single hamburger (say for example a Big Mac weighing 214 g) your contribution to the concentration of greenhouse gasses is the equivalent of combusting 2 L of gasoline. However, if this information motivates you to eat milk for breakfast - in the interest of preserving the environment if not your own health, keep in mind that every milk-cow in the south of the USA produces around 6 700 kg of milk which as a byproduct produces 194 kg of methane (digestion 118 kg, dung 76 kg). This gives us a ratio of 1 kg of methane from digestive sources for each 34.5 kg of milk.
Do you remember the formula for the equivalent of carbon dioxide?
CO2e (methane) = m (methane) · GWP = 1 kg · 72 = 72 kg CO2e
or about 2 kg CO2e per liter of milk.
But that is not all
Deforestation. Behind that word is hidden the greatest victim of man's blind stumbling forward, the forests. We use them in fireplaces for their energy, we poison them with acid rains from the same fireplaces, we cut and burn them to make way for the production of biofuels all the while continuing to calling them the "lungs of the Earth".
Water, CO2, minerals from the ground and Solar radiation are basic components from which plants, using photosynthesis, create compounds essential for life on Earth. It is estimated that the annual primary production of biomass, in the world's ocean and on land is 146 billion tons (only some 5 % of that comes from agriculture). How much CO2 is bound in forests? [30]
To calculate the amount of CO2 bound in plants we need to know a few things first. The combustion of tropical forest releases around 1.6 kg CO2 per kilogram of burnable biomass. Secondly, the amount of dry matter, or biomass, for a typical tropical forest is around 200 t/ha (20 000 t/km2). Deforestation's effect on the increase of CO2 is twofold; on one side the number of trees that bind CO2 is reduced and on the other side extra CO2 is released by their destruction. [31, 32]
The Amazonian rain forests are being destroyed with extreme speed in order to make way for pastures and fields for the cultivation of soy, the main cattle food and raw material for the manufacturing of biodiesel. Brazil, in only ten years, doubled the amount of land cowered by soy: in 2000 from 13.6 million hectares 34.7 million tons of soy was gathered and in 2010 the surface increased to 23.5 million hectares (mostly stolen from the Amazonian rain forest) which produced 69 million tons of soy. [33]
Do not forget that the forests, aside from raw material for the wood industry and as a source of energy contain some other useful functions. Forests filter and clean the air, hold water, prevent erosion of land, lower the strength of the wind and are homes for many plants and animals. Forests also produce oxygen, and I do not think I need to explain why oxygen is useful. However, the allotropic modification of oxygen, ozone, is another story.
Citing this page:
Generalic, Eni. "Global warming and mankind." EniG. Periodic Table of the Elements. KTF-Split, 13 Feb. 2025. Web. 25 Apr. 2025. <https://www.periodni.com/global_warming_and_mankind.html>.
Articles and tables
- Periodic table
- Online calculators
- Scientific calculator for chemists
- Gas laws calculator
- Molar mass calculator
- Angle converter
- Roman numerals converter
- Number systems converter
- Preparation of solutions
- Labeling of chemical containers
- Oxidation numbers calculator
- ARS method
- Oxidation number change method
- Ion-electron method
- Gauss elimination method
- Memory game
- Find the pairs
- Articles and tables
- Chemistry
- List of abbreviations and acronyms
- Crystal systems and Bravais lattices
- GHS - Hazard pictograms
- NFPA 704 Hazard Diamond
- Fundamental physical constants
- Solubility product constants
- SI - International System of Units
- Composition of mixtures and solutions
- Stoichiometric calculations
- Chlorinity and salinity of seawater
- Rare earth elements (REE)
- Ecology
- Web design
- Chemistry dictionary
- Chemistry
- Downloads
- ≡ Menu


